Three problems: two in imagery, one in statistics. Each
entry states the problem, what I built, and where the result currently stands.
Status labels are literal. Work that is unpublished or in preparation is marked
as such, and limitations are stated alongside results.
Martian paleoclimate by counting cracks
Frozen ground on Mars cracks into polygons much as it does on Earth, and the
way those cracks meet can record what the climate did. A crack that stops
against another suggests the ground cracked in sequence, without repeated
freezing and thawing. Three cracks meeting symmetrically suggest it froze and
thawed repeatedly. Cracks that run straight through each other suggest ice
filled the older fractures before new ones opened.
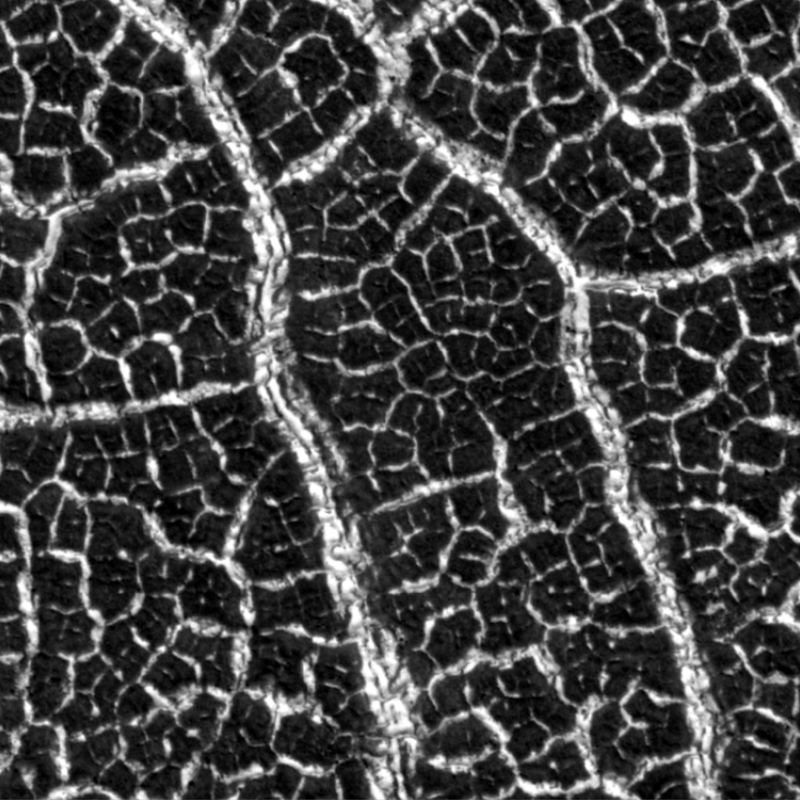
Mars has more than 100,000 orbital images. Junction types have been surveyed
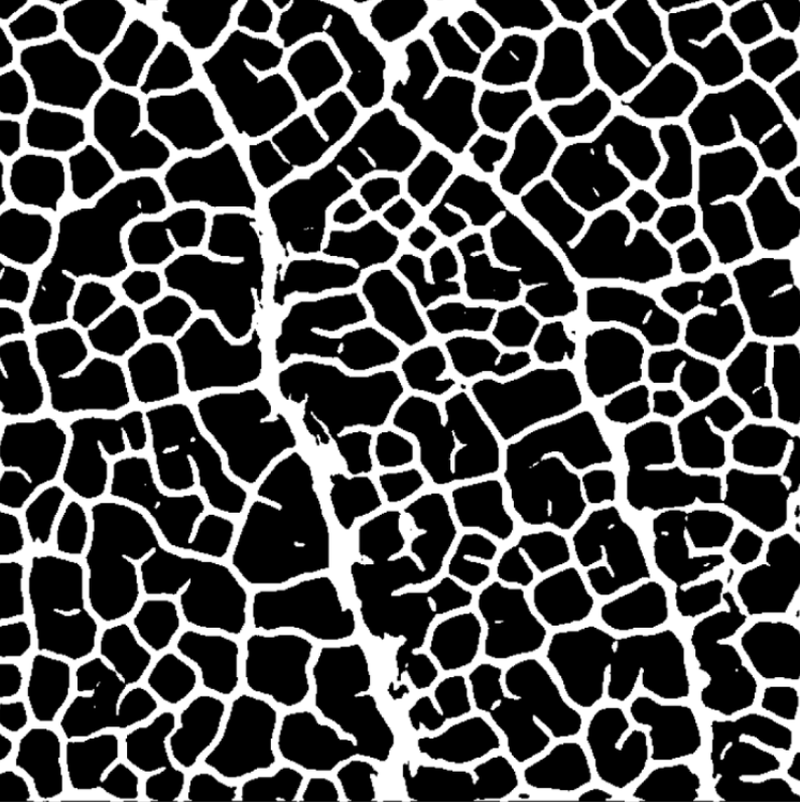
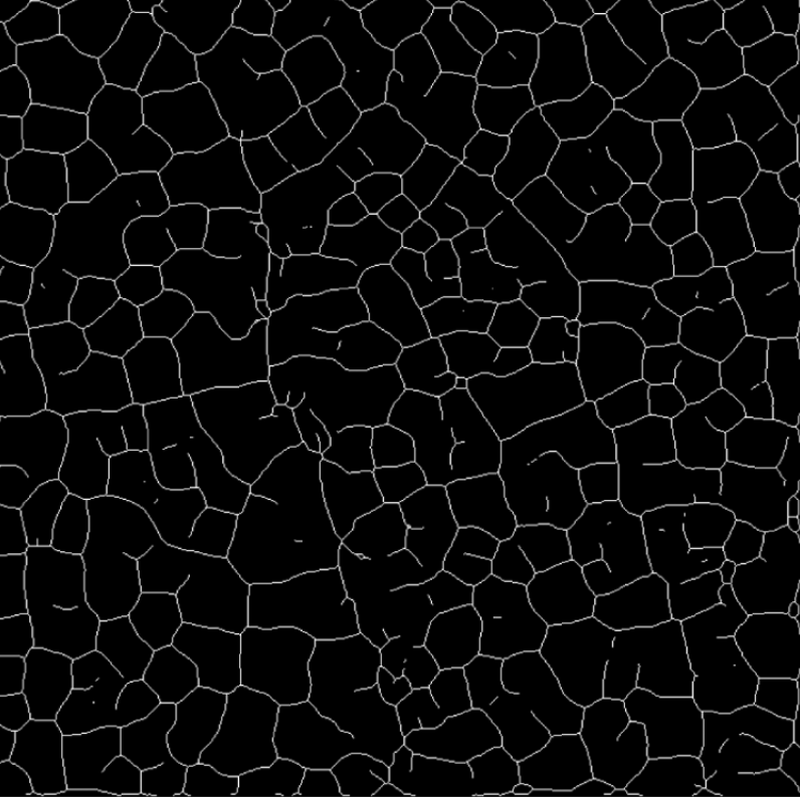
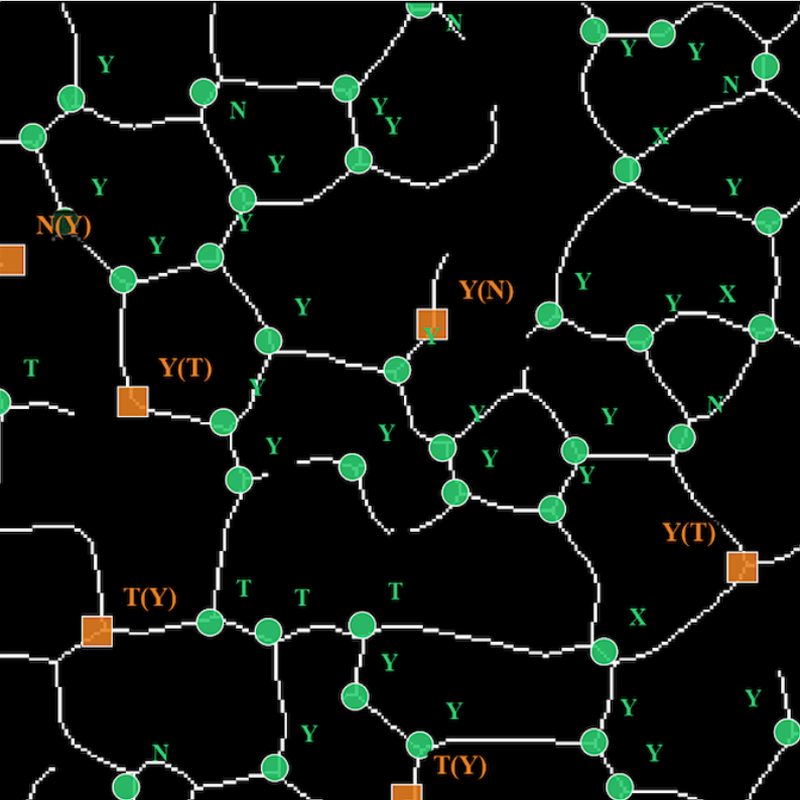
by hand exactly once. I built a pipeline that finds these junctions and
classifies them, labeling 84% correctly overall and 75% when the three junction types
and the non-junction class are weighted equally, since the rarer types are the hard ones. It needs as few as 25
to 50 junctions to tell one terrain from another.
On 19 images of western Utopia Planitia, Mars, the junction mix shifts with
latitude as predicted, and aligns with an independent ice-stability proxy also
used for paleoclimate interpretation. The pipeline recovers that signal at a scale
impractical for manual surveys.
A planet's worth of imagery is far too much to download, so the pipeline
reads only the small piece of each image it needs, directly from the archive,
and finds its own inputs rather than being handed a list. Before that change
shipped I checked it against the old approach to confirm the results came out
identical. It runs on rented GPU capacity that can be taken away mid-job, with
a spending cutoff so an unattended run cannot get away from me.
01 Raw tile
02 Mask
03 Skeleton
04 Junctions
Training the classifier meant labeling junctions by hand, one at a time, so I
built a tool for it: the skeleton for context, the crosshair on the node in
question, four keys for the four classes, and a running count of what was left.
TYXN Labeler, the annotation tool I built to produce the
junction training set. Code released with the paper.
The classification method and pilot deployment are under
review at JGR: Machine Learning and Computation (first submitted April 2026,
resubmitted July 2026), not yet accepted. The planet-scale deployment is in preparation. Train and test splits
for the detector are made at the tile level, so adjacent tiles from the same
image can appear in both, and its performance should be read as an upper bound
on generalization to unseen scenes. An earlier version of the classifier had a
leakage problem between the training and evaluation splits; I found it, and the
full eight-method model stack was rebuilt and re-evaluated on clean data.
Code released on acceptance
Under review · scale-up in progress
Training on Earth, deploying on Mars
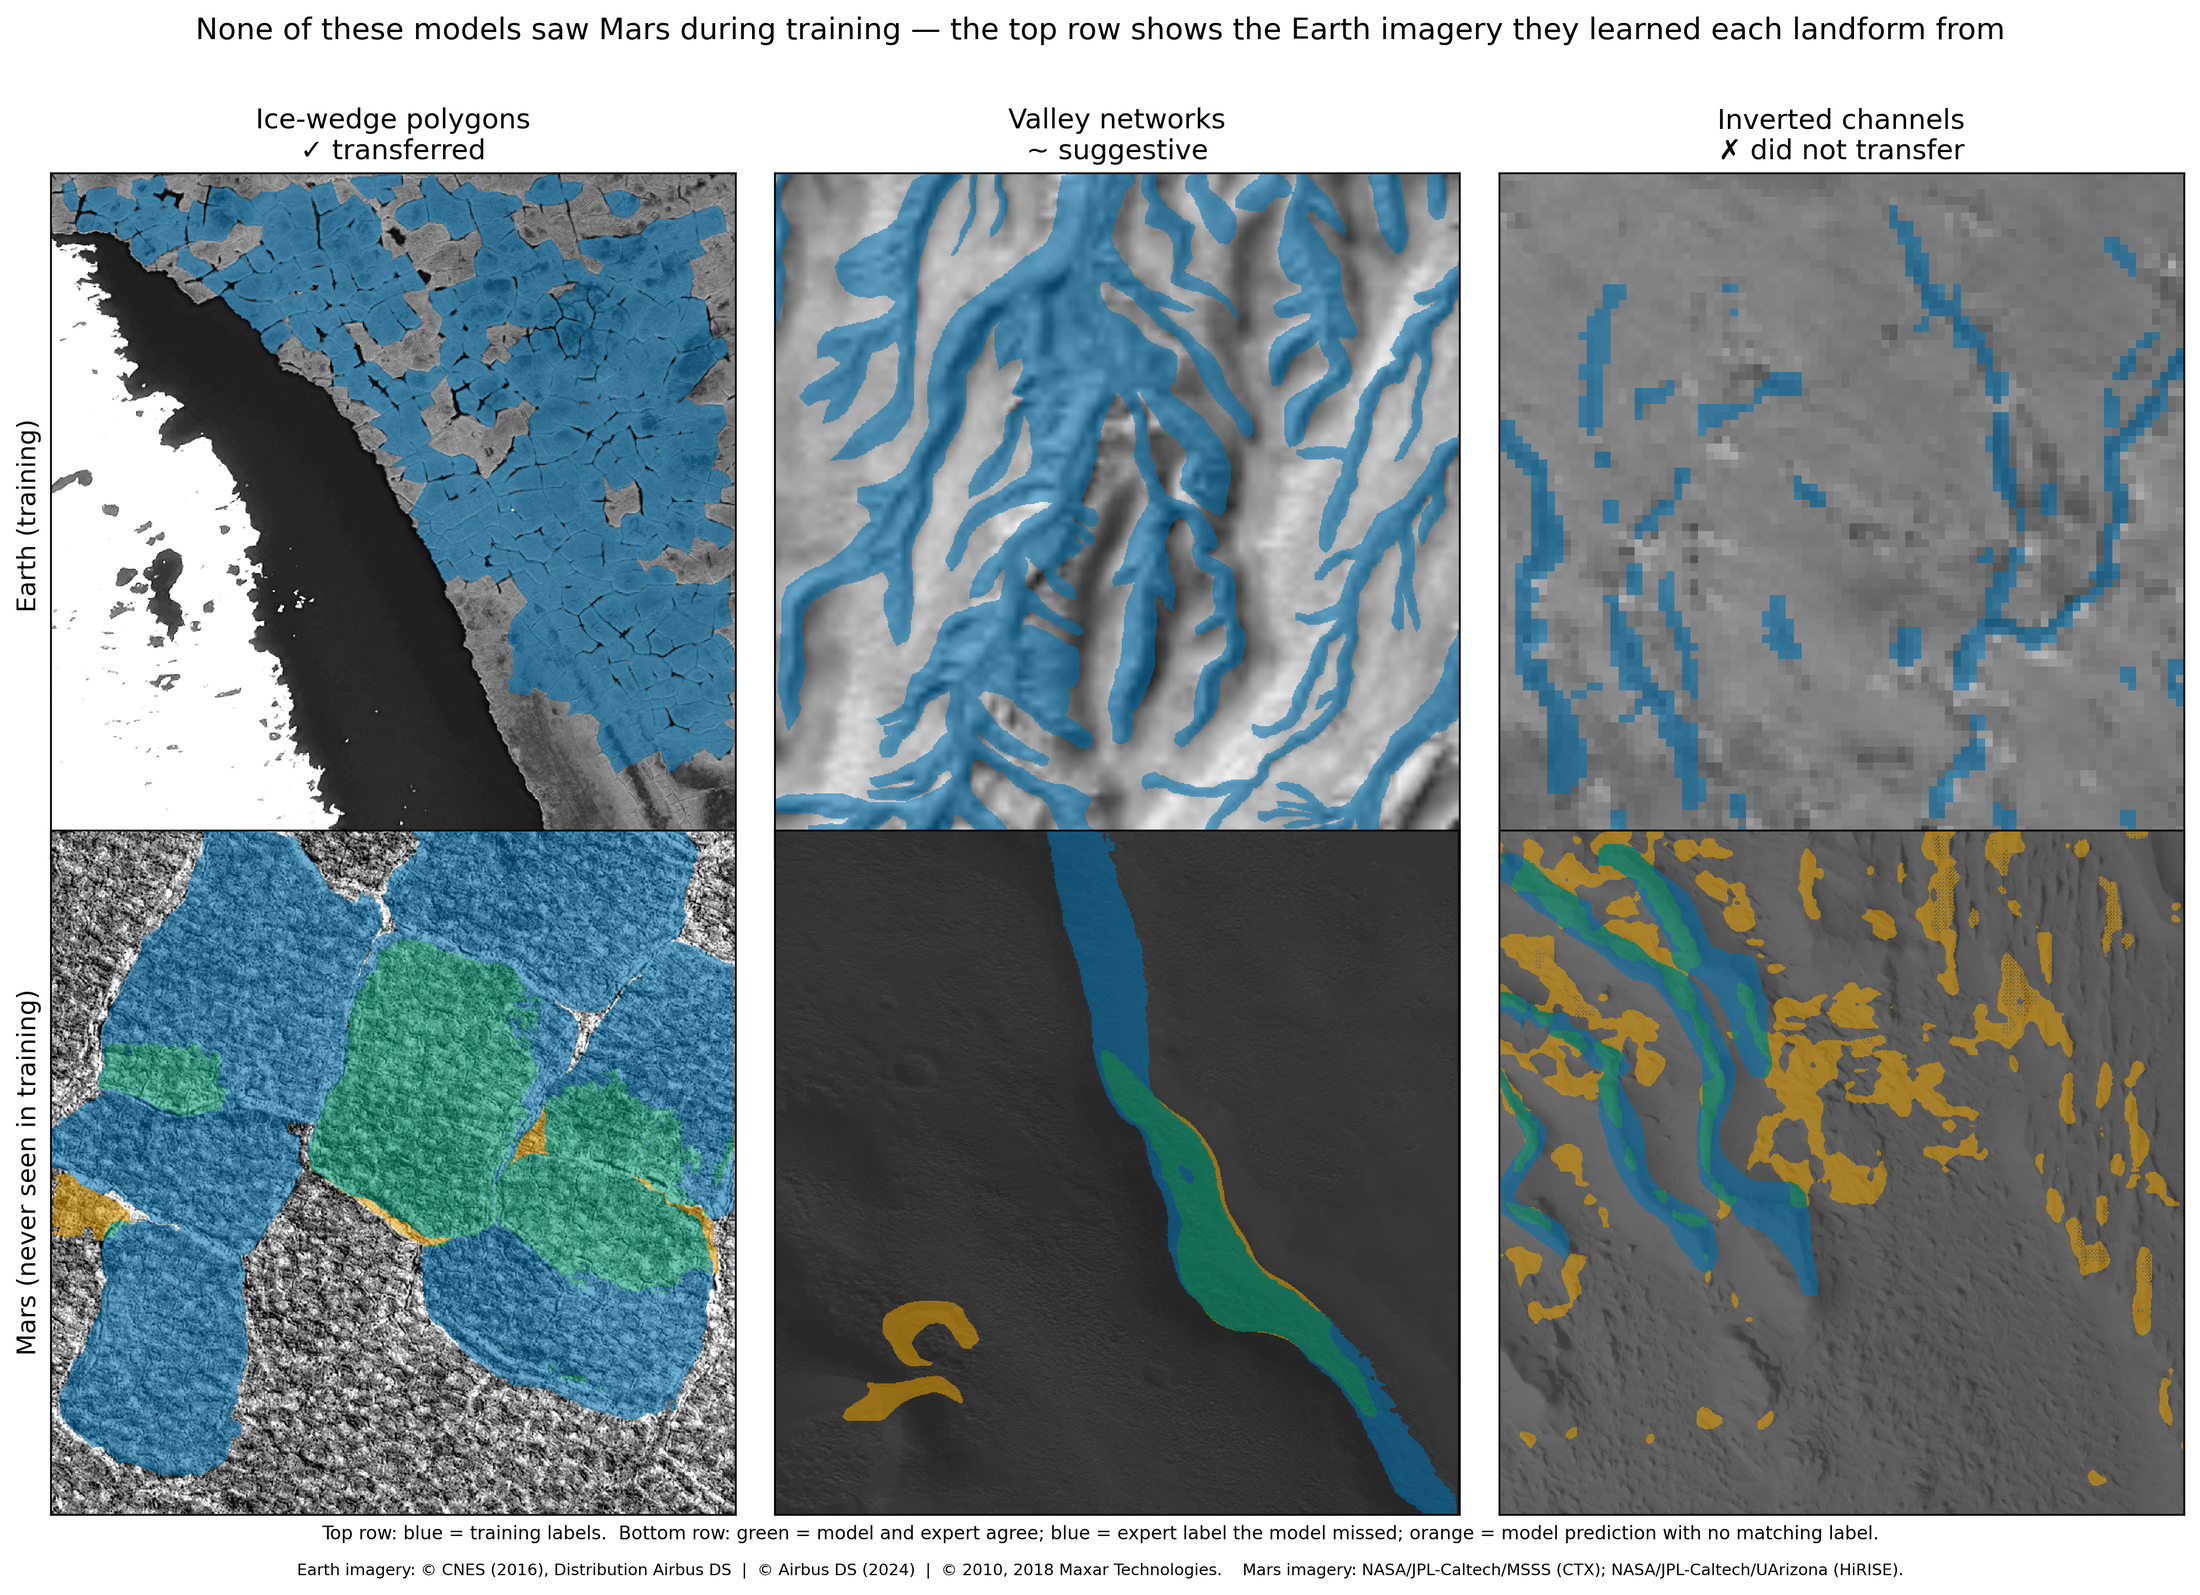
Can an AI model trained only on satellite images of Earth recognize the same
kinds of landforms on Mars? Geologists have reasoned this way for over a century,
reading martian terrain through its closest Earth counterparts, and this project
asked whether that reasoning survives being handed to a machine. I trained
image-segmentation models on three Earth landform types: polygon-patterned tundra
in the Arctic, ancient riverbeds preserved as ridges, and branching valley
networks. Then I set them loose on Mars orbital imagery, asking two questions.
Where does the Earth analogy hold, and what, if anything, still has to come from
Mars?
The three landforms gave three different answers. Valley networks hinted at
real transfer, but the handful of well-mapped martian examples was too small to
prove it. The ridged riverbeds were the hard failure: at the resolution of
Mars-wide imagery, a model trained on Earth did no better than one that simply
labels the entire image a riverbed. The polygonal terrain succeeded. An
Earth-trained model found martian ice-wedge polygons that the same model,
stripped of its Earth training, could not, and that margin is the analogy's
contribution, isolated.
So what crossed the planetary gap, and what didn't? Earth taught the models
what these landforms look like. What Earth could not supply was scale: the
martian examples in our data are several times larger than the terrestrial ones
the models trained on, a mismatch between the datasets we could measure, whatever
it reflects about the planets. Adding martian training data improved every model,
on every landform. And one experiment showed how badly the alternatives fail:
taught only from its own mistakes, a model concluded that Mars had no such
landforms at all, while staying just as accurate on Earth. Earth can teach a
model what a landform looks like. Teaching it what that landform looks like on
Mars is a separate problem.
Can a Martian dust storm be predicted? Researchers have spent decades hunting
for the signals that precede major storms, and many candidates have been reported,
but none has yet been shown to outperform the two forecasts that come for free:
the season's usual storm rate, and the conditions already prevailing. That led me
to ask whether the existing storm record contains enough information to prove that
a precursor signal beats those free forecasts.
It does not. Mars has produced only about a dozen independent major storms
since continuous observation began, far too few to tell a working forecast from a
lucky one.
For mission planners this turns an open question into a concrete number. Storm
risk on Mars must, for now, rest on seasonal climatology, and any future forecast
claim can be checked against the bar this work sets before anyone acts on it.
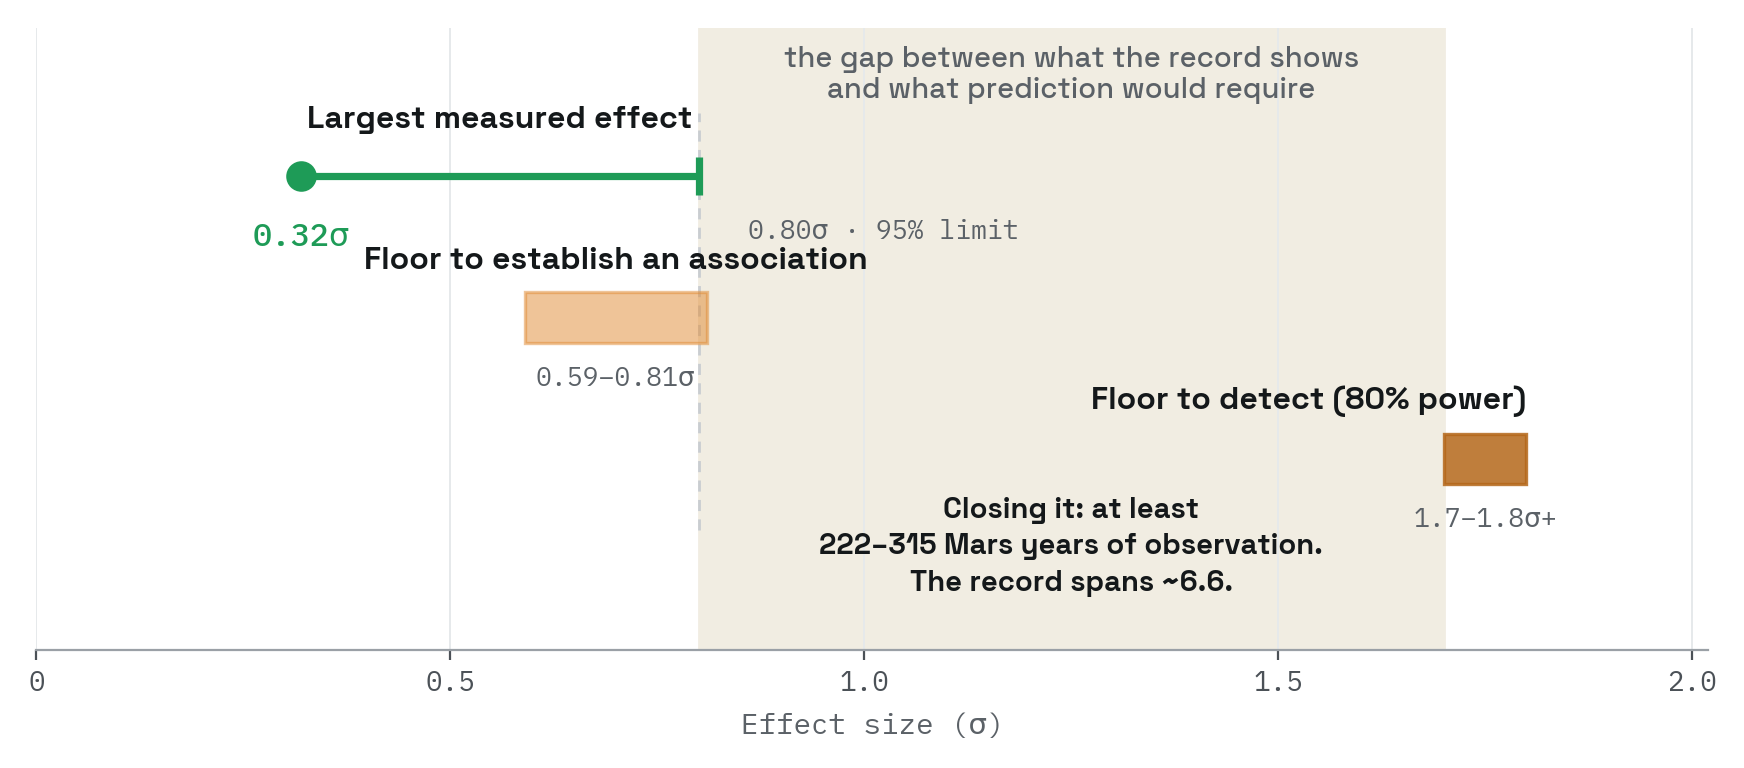
The measured signal falls short of the bar it would have to clear.
Point and whisker: largest season-controlled effect measured, with its one-sided 95% upper
limit. Bands: the effect size this record would need to establish an association, and this
design would need to detect a precursor at 80% power. Even at the larger, season-uncontrolled
effect (0.56σ), closing the gap by observation would take at least 222 to 315 Mars years;
the usable record spans about 6.6.
For this record and design, detecting a precursor at 80%
power requires roughly 1.7σ, or 1.8σ and above once storm clustering is
counted. The largest season-controlled effect measured is 0.32σ, with a
one-sided 95% upper limit of 0.80σ. Even at the larger, season-uncontrolled
effect (0.56σ), closing that gap by observation would take at least 222 to
315 Mars years, roughly double that once clustering is counted, and about
four times more at the season-controlled effect; the usable record spans
about 6.6. Merely detecting the association, at a season-controlled effect,
would take roughly 30 to 55 Mars years.
This is a predictability assessment and not a forecasting
system. Since the project moved to version control on August 3, 2026, methods and
decision thresholds were committed before each run, so for those runs the
commit history is the record that nothing was decided after seeing results. One run was killed mid-flight when a check caught rows reading
atmospheric data from up to about an hour after the forecast was made; no result was read before
the fix, so the added robustness tests are provably not after the fact. The 80%-power floor is specific to this design; the association floor is a
property of the record. The nulls exclude
effects large enough to support prediction for the features and estimands
tested; they are not evidence that precursors do not exist.
Pre-registration and code: Zenodo deposit forthcoming